Publications
1-6 of 6
-
Road Safety Data
Improving Road Traffic Injury Statistics in Low- and Middle-Income Countries
November 2023
- National decision-makers recognize the issue of underreporting but tend to dismiss higher estimates by global statistical models.
- Most countries use WHO GSRRS estimates.
- National health surveys and censuses in LMICs often contain relevant information, and minor modifications can greatly improve their usage for such measurements.
- Incorporating national health survey data into global statistical models can help resolve discrepancies and increase confidence in estimates.
- Integrating epidemiological data sources into global statistical models (GBD, GHE, GSRRS) to reduce discrepancies and increase confidence in their estimates.
- Including relevant questions in upcoming national data collections to facilitate epidemiological measurements of road traffic injuries.
- Encouraging local involvement in data production for better estimates.
- Enhancing coordination between the Institute for Health Metrics and Evaluation and the World Health Organization to improve estimates and reduce inconsistencies.
-

-
-

Road Safety Data
DRIVER: The World Bank’s Sustainable Solution for Road Crash Data Management
March 2018

Road safety is a global health and economic issue that disproportionately affects low- and middle-income countries (LMICs). Precise data is crucial for understanding the full scope of the problem and developing effective interventions, but LMICs struggle to collect comprehensive data due to limited resources, underdeveloped health systems, and inconsistent data collection processes.
To overcome reporting gaps, three major global statistical models are utilized: The Institute for Health Metrics and Evaluation Global Burden of Disease (GBD) study, the World Health Organization (WHO) Global Status Reports on Road Safety (GSRRS), and WHO Global Health Estimates (GHE). However, discrepancies exist among these models and between them and official country statistics. They often estimate significantly higher road traffic fatalities and injuries than official LMIC statistics.
This GRSF study identifies the reasons behind statistical discrepancies and outlines strategies to strengthen modeling efforts. This involved qualitative research, a systematic review of national data availability, and four case studies in Brazil, Cambodia, Ethiopia, and Tanzania.
Key findings include:
Recommendations include:
To achieve the goal of the Second United Nations Decade of Action for Road Safety (reducing road traffic fatalities and injuries by 50% by 2030), substantial resources need to be allocated to road safety and accurate reporting and statistical estimates are required.

Road traffic crashes result in an estimated 1.35 million deaths and 50 million injuries worldwide per year with over 90 percent of these occurring in Low-Middle Income Countries (LMICs). Aside from the obvious pain and suffering this inflicts on individuals and communities, these deaths and injuries also place a large financial burden particularly on LMICs, by slowing economic growth.
The scale of the current response to this continuing crisis does not match the size of the problem. In addition, limited road safety resources are often expended on ineffective or suboptimal interventions. While road safety knowledge has improved over recent decades, there is still a need to improve decision making when selecting and applying effective evidence-based road safety interventions. Effective interventions are those that reduce fatal and serious injuries.
The World Bank's Global Road Safety Facility (GRSF) has developed this evidence-based guide on “What Works and What Does Not Work” in road safety in response to the critical need for effective evidence-based solutions.
This guide has been prepared to help readers understand that not all road safety interventions are equally effective and that what appear to be “common-sense” approaches to selecting road safety interventions will often not be the best. Although some provide benefits, others have very limited or even negative impacts, despite being commonly—and mistakenly—recommended or accepted. The guide offers a range of recommendations with a focus on interventions in LMICs, although the information may also be of relevance to all countries. The contents will be valuable to those working on road safety at policy or practitioner levels, including World Bank technical team leaders and others who seek to establish, expand, or improve road safety programs in LMICs.
The guide sets knowledge on evidence-based interventions within a “Safe System” context, providing advice on each of the Safe System pillars (road safety management, safe roads, safe speeds, safe vehicles, safe road users, and post-crash care) while recognizing that evidence-based solutions must be drawn from across pillars to produce effective road safety outcomes. At the core of this document is a summary table with an overview of beneficial and non-beneficial interventions based on sound scientific evidence. This is followed by more detailed information including case studies and references to the evidence base to support the summary.
Many safe road interventions are recommended for adoption, including integrated public transport, roadside and central barrier systems, medians, infrastructure to support appropriate operational speed for road users, roundabouts, grade separation and interventions to reduce exposure to risk at intersections, pedestrian footpaths and crossings, separated bicycle and motorcycle facilities, and traffic signs and line marking (including audio-tactile line marking). Some of these are highly effective, with up to a 70 or 80 percent reduction in fatalities and severe injuries (for example, safety barriers and roundabouts).
Various speed-related interventions also produce significant benefits, with some able to almost eliminate death and serious injury. Examples of effective speed interventions include traffic calming (including humps and chicanes), roundabouts, raised intersections and crossings, gateway treatments, lower speed limits (including 30 km/h (20 mph) zones for pedestrians) and speed cameras.
A variety of road user-based interventions have been implemented over many years, with effective examples including extensive supervised on-road practice and/or graduated licensing systems as part of the driver-licensing system, increased age for driving license eligibility, hazard perception training and testing, public education and campaigns as part of an integrated strategy (especially communicating enforcement to increase general deterrence), enforcement, penalties, alcohol interlocks, fatigue and speed monitoring, and increased helmet wearing rates.
Key vehicle-based interventions include applying minimum vehicle safety standards and vehicle ratings (through the Global New Car Assessment Program, or “NCAP”), seat belts, periodic vehicle maintenance, daytime running lights, under-run guards on trucks, Electronic Stability Control, and other advanced vehicle technologies.
Enhanced post-crash care can also produce better road safety outcomes, including systems to improve emergency response time, better emergency care, improved first aid skills for the public, and improved hospital care.
Equally important, the report also identifies clear examples where interventions are not effective. The worst of these are interventions that increase risk. These include increasing travel speed without improving quality of safety infrastructure, most forms of post-license driver and rider education and training, and many (but not all) forms of regular school-based driver education (such as those that seek to increase car-handling skills). The increase in risk is typically because such initiatives increase the level of confidence leading to an increase in risk taking. Other interventions that have no demonstrated safety benefits are to be avoided. These include license schemes through application or payment, training programs or education within schools that aim to improve road safety knowledge (including ad hoc visits by road safety experts or enthusiasts), and education campaigns conducted in isolation.
There are effective alternative interventions for each of these as described within this document, and these should be applied instead. It is extremely important that resources are not wasted on ineffective interventions on behalf of road safety but rather that evidence-based road safety interventions are employed.
There are a variety of documents available on the issue of road safety intervention effectiveness, many of which are referenced here. However, there are some key points of differences and added value in this guide, including a synthesis of the evidence on a broad range of interventions and a contrast between effective and noneffective interventions, allowing readers to compare options. Where noneffective interventions are identified, viable effective interventions are provided thereby supporting decision making. The guide also provides direct advice to those working in LMICs, drawing on key sources of information where this is available. Importantly, concise yet robust evidence is provided across each of the Safe System pillars.
There is a need to continue building the knowledge base on effective road safety interventions, particularly in LMICs where there are a number of gaps in knowledge. The contents of this guide represent a useful, up-to-date summary of current knowledge for application.
Download the document in English
Download the document in French
Download the document in Spanish
In many countries around the world, deficiencies in data or data quality impair evidence-based road safety policy making. While many countries collect road safety data, the collection is not necessarily comprehensive. Further, many countries can be unaware of data gaps in their system, which prevents them from soundly analyzing their road safety problems. Therefore, road safety data definitions and collection methods must converge into standard international criteria, thus allowing for comparisons in space - across countries - and in time.
This is the raison d’etre of regional road safety observatories, which have been developed, for example, in Latin America (OISEVI), Africa (ARSO), and Asia-Pacific (APRSO). They present an opportunity for joint regional efforts to improve, in a harmonized way, road safety data collection and analysis. Regional road safety observatories promote the adoption of a common set of road safety indicators based on common definitions and serve as an avenue to assist countries in improving the management of their crash data systems.
This document is designed to support reviewers in the assessment of road safety data collection; the complete range of safety data should be considered. This task can be complicated because collection of road safety data is often not achieved by activities dedicated to this purpose, but rather through piggybacks on other sources. For example, activity reports from police or hospitals are used to provide material for legal or medical purposes. The routines involved frequently have a long history in which gathering reliable and complete statistics has had secondary priority, at best. The various actors involved reflect the complex structure of a country’s judicial and executive system, which, generally, are not coordinated. Consequently, any review of the data collection process requires some “detective work.”

Based on 2018 findings of the World Health Organization (WHO), the number of deaths due to road crashes is 1.35 million deaths per year. While this number is quite high and increasing every year, the rate of road crash deaths per 100,000 of population has remained constant, at around 18 deaths, over the years. This rate of deaths is however not distributed proportionately amongst the different regions and countries. The high-income countries have recorded lowest average rate at 8.3 per 100,000. In contrast to this number, low-income countries have the highest annual road traffic fatality rates averaging at 27.5 deaths per 100,000– more than three times the average for high-income countries.
ROAD CRASH AND IMPACT
Most of the deaths and injuries from road crashes are of the working age population, which negatively impacts both the economy and the demography of the region. Road traffic injuries are currently the 8th leading cause for death for all age groups, and further compounding the demographic impact is the fact that road crashes are the leading cause of death for children and young adults, between the ages of 5 and 29 years.
Road traffic crashes have a high economic impact, costing 3 percent of a country’s GDP on average. They also cause a significant impact on the individuals as well as their families. Injuries arising due to road crashes can lead to trauma for the individual and loss in productivity. Along with costs of treatment, economic challenges may further be increased due to temporary or permanent loss of income as well. Along with the victim, road crashes take an emotional toll on the immediate family members and caregivers during the treatment process or any deaths and add to the economic burden as they may need to take time off work or school to care for the injured.
The distribution of road users varies within different regions and income groups of countries. This impacts the variations in death rates amongst the users. The low- and middle-income countries have a significantly high proportion of pedestrians, cyclists and two- or three-wheeler motorized vehicles. Overall, the global road traffic deaths for pedestrians and cyclists is at 26% and another 28% for two- and three-wheeler motorcyclists, totaling nearly 54% of vulnerable road users. This proportion varies in comparison between the economic group of countries, with a high percentage of road crash victims being car occupants.
Globally, a significant percentage of road crash victims being car occupants is also an indicator of insufficient infrastructure for controlling traffic speeds and volumes. Furthermore, when people use private cars more for their daily activities, it results in a higher level of total vehicle-kilometers traveled (VKT). Choice of using personal vehicle over using non-motorized transport or public mass transport may be attributed to the car-centric planning and design of road infrastructure. Many countries lack adequate protected infrastructure for pedestrians and cyclists. This discourages users to walk or bicycle to their destinations.
Mode-choice plays a critical role in road safety. Public mass transit systems not only provide faster and safer transportation mode choices, they also help reduce dependency on privately owned vehicles on the road. Public mass transit services typically follow designated routes as well, thereby minimizing interferences between different types of road users. While many countries still have to develop mass transit infrastructure such as metro rails, public bus system is quite prevalent, with bus rapid transit (BRT) and bus only lane infrastructures being developed. Absence of proper first and last mile connectivity to the transit stations poses security threats for road users and discourages them from using public transport.
SAFE SYSTEM APPROACH
The Safe System approach derives from the Swedish Vision Zero and Dutch Sustainable Safety strategies that have a long-term goal for a road traffic system to be eventually free from fatalities and serious injuries. It represents a shift away from traditional approach of preventing collisions to a more forgiving approach of preventing fatalities and mitigating serious injuries in road crashes. The traditional approach emphasizes the responsibility of road users to avoid crashes rather than the responsibility of system designers to provide a safe mobility system.
The Safe System approach takes into account that humans are vulnerable and fallible, and errors are to be expected. It aims at ensuring these mistakes do not lead to a crash, and if a crash does occur, it is sufficiently controlled to not cause a death or a life-changing injury. Thereby with a “zero-harm goal”, it places a strong emphasis on road builder/operator and vehicle manufacturer accountability for road safety performance.
The Safe System approach emphasizes shared responsibility. Government agencies at different levels and a range of multisectoral agencies and stakeholders – including policy makers, road engineers, planners, vehicle manufacturers, enforcement officers, emergency medical agencies, road safety educators etc. – are accountable for the system’s safety and all road users – drivers, cyclists, and pedestrians are responsible for complying with the system rules.

Road safety is a major public health issue in Cambodia. Reducing the number of road crashes is a priority for the government. Accurate data are needed to design the most effective interventions. Improving the current crash data system will furnish a more comprehensive picture of critical road safety issues in Cambodia and provide the basis for developing policies to save more lives.
In the framework of the development of the Asia Pacific Road Safety Observatory (APRSO), the World Bank and the International Transport Forum (ITF), with the support of the Cambodian Government, initiated a project aimed at assessing the crash data system in Cambodia and developing a road map for strengthening this system.
This project follows up on a previous twinning project between Cambodia and the Netherlands, undertaken in the framework of the International Road Traffic and Accident Database (IRTAD) group of ITF in 2010-2014. That project concerned both a review of the Road Crash and Victim Information System (RCVIS), and training and support to develop a national road safety strategy and related indicators.
The current project started in 2019 and was carried out by the World Bank and the ITF, with support from the Global Road Safety Facility (GRSF) and UK AID. The Dutch Road Safety Research Institute, SWOV, was contracted by the ITF to lead the review.
This report provides conclusions and recommendations on the basis of the data review mission undertaken in December 2019.
If you are reading this, you probably already know that 1.3 million people are killed on the world’s roads each year and another 20-50 million are seriously injured – 90 percent of these tragedies occur in developing countries. Having such figures help us understand the gravity of the epidemic we are facing; however, when we look at most low- and middle-income countries’ road crash data, the official numbers often do not match up with the reality of their roads.
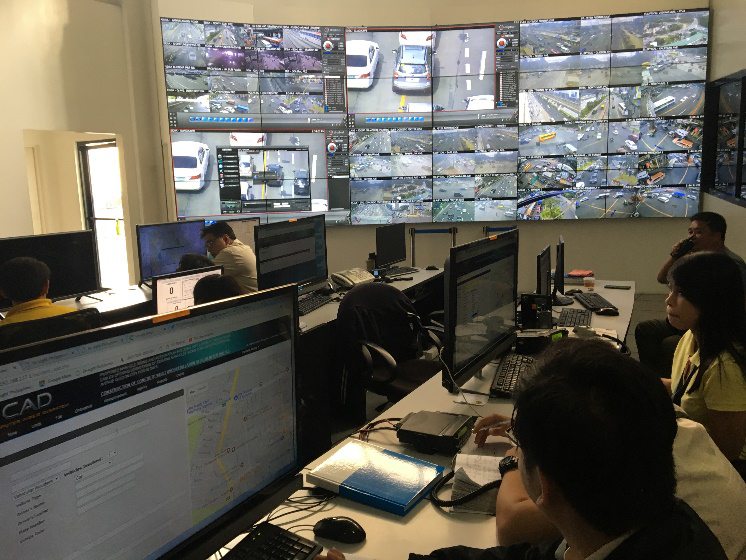
Many road crashes go un-reported, certain incidents – such as those involving cyclists or property damage-only – are under-reported, and in a vast number of records, the data are incomplete (lacking even the location of the crash). Being able to efficiently and accurately collect, analyze, and report road crash data, is the first step to tackle this problem, and this is where DRIVER comes into play.
Developed by the World Bank in 2013, the Data for Road Incident Visualization, Evaluation, and Reporting (DRIVER) system, is a free web-based, open-source platform that improves the collection, management, analysis, and reporting of road crash data by enabling multiple agencies such as the police, health care providers, and local/national government agencies, to geo-reference road incidents in the same database in real time. It was first piloted in two Philippine cities, Cebu and Manila and since then, the GRSF has supported the improvement and deployment of DRIVER through workshops, pilot projects, implementation support and scaleup in countries such as Brazil, Bangladesh, India, Kazakhstan, Laos, Thailand, Vietnam, and Saudi Arabia.